
Explore Corn
Growing Degree Days
Grade Levels: Middle School,High School
Driving through Kansas, it is difficult to miss fields of corn in the spring and summer. In an average year, more than 500 million bushels of corn are harvested in Kansas. That’s a lot! With numbers like that, one might believe it is easy to grow corn in Kansas. It goes well beyond just planting and watering though. There’s a science behind knowing when to plant corn, when to expect different stages of growth, and when to harvest – it’s called growing degree days (GDD).
In the spring, there are many important factors to consider when a farmer is thinking about planting corn. Are we done with freezes for the season? Is there moisture on the way? How much light is hitting my plants? While these are in the forefront of a farmer’s mind, another major factor is going to be temperature. We are not only talking air temperature, but also ground temperature.
According to the Kansas State University Department of Agronomy, if a farmer plants corn from when the ground temperature is between 50°F and 55°F, it can take 18 to 21 days to see emergence. If the farmer plants corn when the ground temperature is between 60°F and 65°F, it might only take 8 to 10 days to see emergence. What a difference! Iowa State University’s Department of Agronomy adds that corn will not grow below 50°F. Corn grows best in conditions between 50°F and 86°F. Between 86°F and 93°F, corn continues to grow, but the increase in temperature does not give additional benefit to the plant. Above 93°F, there can be a negative impact on the growth of corn. Above 110°F, true heat stress can occur on the plant. In general, warmer weather helps corn grow and cooler weather slows growth. It is recommended that students complete the Kansas Corn: Explore Corn lab prior to completing this lesson. This will help the students understand the growth stages of corn as they compete this lab.
Instructional Video for Teachers

Teaching the Lesson
- Kansas College and Career Ready Standards
- Learning Objectives
- Materials
- Procedures for Instruction
- Classroom Discussion
- Procedure for Lab
- Teacher Resources
- Reflection and Conclusion
- Assessments
- Science and Agriculture Careers
- Sources
- Disclaimer
Procedure for Lab
Calculating Growing Degrees Days for Corn
On the second page of the Growing Degree Days Student Packet, students are introduced to the Growing Degree Days (GDD) calculation.
This equation helps farmers calculate what stage of life their corn plant is in. It takes into account air temperature for any given day. The calculation is below:
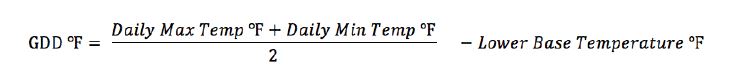
The temperature will not always be between 50°F and 86°F. That is where a few rules come in when using the GDD equation. Make sure you explain these rules to students!
- Rule 1: If your minimum or maximum temperature is below 50°F, set it to 50°F in the equation.
- Rule 2: If your maximum temperature is above 86°F, set it to 86°F in the equation.
Remember, the growth process for corn halts with a temperature below 50°F; therefore, 50°F is our Lower Base Temperature. Also, remember that corn does not see a noticeable positive impact with temperatures above 86°F; therefore, 86°F is our Upper Limit Temperature.
So, if on a sunny May day, our high temperature was 70°F, and our low temperature was 54°F, our equation would look like this:

That would give us a GDD number of “12” for that sunny, May day. The more growing degree days we “accumulate,” the farther along the corn plant is in it growth. Often, students hear the term growing degree days, and think they are adding the number of days together. In actuality, you can accumulate many growing degree days in one day. It is simply a number.
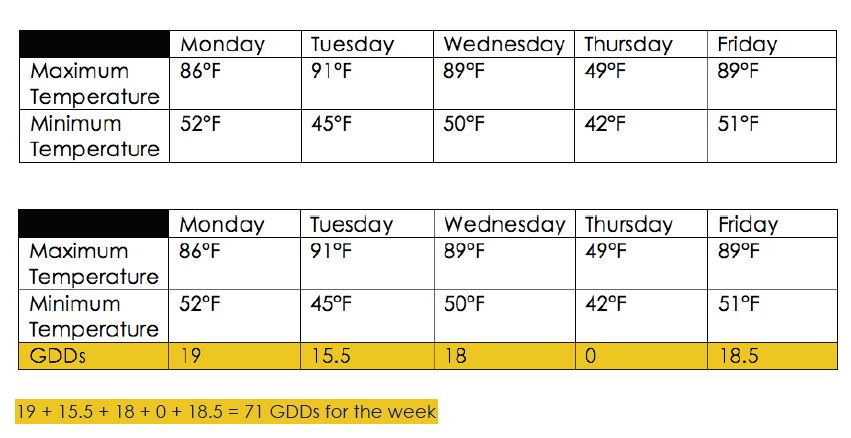
After looking at the two examples in the Growing Degree Days Student Packet, show students the Growing Degree Days PowerPoint slide with information from the chart below (Slide 5). Have students work through the maximum and minimum temperatures to see if they can calculate the total number of growing degree days for that week. This concept is very unfamiliar to many students, so you may want to work through the data on Monday and Tuesday, then turn them loose to calculate the rest of the week.

Throughout this random week, our corn plant has “accumulated” 51.5 growing degree days.

According to the chart below from Clemson Cooperative Extension (this table is also in the Growing Degree Days Student Worksheet and in the Growing Degree Days PowerPoint), our corn plant would not have even emerged from the ground. We need to accumulate another 73.5 (125-51.5) growing degree days before that will happen. It could by the end of the next week!

With the rules explained earlier in mind, now have students practice by calculating the growing degree days for this random week in May. The chart below is in the Growing Degree Days Student Packet.
Real World Practice
Now, students will get real world experience. Have them go to the High Plains Regional Climate Center Website.
The student instructions are in the Growing Degree Days PowerPoint (Slide 11), but when students go to the website, the map will be zoomed in on Kansas. Have them choose a field in Kansas (any field!) by clicking on the field and then “Create GDD Graph”. A chart will pop up for that field. The county where the field is located will be listed at the top of the chart.
- Have students determine the earliest first freeze, as well as the latest last freeze. That is important, because you want to grow corn in areas with longer growing seasons.
- Now, have students unclick all of the lines except “2017 GDD”, which is found in the grid box in the graph (or the year listed).
- Have them hover over the remaining line. They will see GDDs accumulate as they move over the line.
- Using the chart on their Growing Degree Days Student Worksheet, have them determine the dates when enough GDDs will have accumulated for each stage of growth.
- When will the corn be ready for harvest? Usually, this will happen around R4.
- Have the students compare their results from fields around the state. Where in Kansas would you want to grow corn based on the results?
Now, have students click back to the map they saw when they first went to the website. Have them back up the map on the website so they can see other highlighted states.
- Have them use the Growing Degree Days Student Worksheet to guide them through picking two other fields. (This is good practice for students to remember where states are located!)
- Once finished, have students answer the questions on the back of the Growing Degree Days Student Worksheet.
About Kansas Corn STEM
Investing in Kansas teachers and students is a priority for the Kansas Corn Commission. We are committed to providing materials and training to support STEM education while fostering an understanding of how corn farming and agriculture fit into our daily lives. Professional development workshops are offered to teachers seeking to expand their knowledge and inquiry-based teaching skills. Workshop participants receive free lab supplies needed for the lessons.
Workshop InfoThis lesson is the work product of the Kansas Corn Commission. Our lessons are written in collaboration with Kansas teachers for use in the classroom. Teachers may copy and share this curriculum. Use of this product for commercial or promotional use is prohibited without express permission of Kansas Corn.
Newsletter Sign Up
Each quarter we release a newsletter written by teachers for teachers. This is an easy way to keep up with what is happening at Kansas Corn STEM.
Subscribe Today!