
Explore Corn
How Sweet It Is
Grade Level: High School
High fructose corn syrup (HFCS) is a sweetener produced from corn starch. This sweetener is used in many applications and has received much criticism and blame for health problems such as obesity and diabetes. This is attributed to the “high” fructose content indicated in the name. While the use of this sweetener is important to the corn industry, it is equally important to examine any truth to the claims. This lab will look at the sugar make up of HFCS as found in bottled soft drinks and compare it to table sugar (sucrose), dextrose (glucose), light corn
syrup and the “natural” sweetener, honey.
Teaching the Lesson
- Kansas College and Career Ready Standards
- Learning Objectives
- Materials
- Safety Considerations
- Procedure for Instructions
- Background Information
- Classroom Discussion
- Procedure for Lab
- Teacher Resources
- Lab Analysis
- Reflection and Conclusion
- Science and Agriculture Careers
- Disclaimer
Classroom Discussion
Introduce the topic and assess to students for prior understanding.
- What are simple carbohydrates or sugars primarily used in animals? Carbohydrates are primarily an energy source in animals. Providing 4 kcal/g of energy.
- What compound has the formula C6H12O6? This formula represents both glucose and fructose. They are Isomers – molecules with the same composition but different arrangement. (Same formula, different structure) Glucose and fructose, both C6H12O6.
- Does this structural difference really matter? Fructose tastes sweeter than glucose. Monosaccharides, Fructose and Glucose are similar but are metabolized differently by the body.
- What does the body produce in response to an increase in blood sugar? Insulin is produced in response to glucose. This helps cells pull glucose from the blood to use as fuel. Fructose in the blood does cause the same insulin response. Glucose can be absorbed directly into cells while fructose must be modified in the liver.
- What type of sugar is often marketed as “real sugar”? Cane sugar or table sugar that students are familiar with is sucrose. Sucrose is a disaccharide. Disaccharide means “two sugars”. They are sugars composed of two monosaccharides the two main disaccharides in the sweeteners we will test are Sucrose (glucose-fructose) and Maltose (glucose-glucose). These are common in sweeteners and will need to be broken down with enzymes to determine the amounts of glucose and fructose they contain.
- What type of molecules are used to break or build molecules in living organisms? Enzymes fit specifically to a molecule and break it, invertase breaks the sucrose into glucose and fructose and glucoamylase breaks the maltose and short chains of glucose into individual glucose molecules.
- Are their sugar types that are healthy, unhealthy? Have groups list one healthy and one unhealthy and why they think these are healthy or unhealthy.
Let students discuss their ideas and guide the discussion without telling them if they are right or wrong.
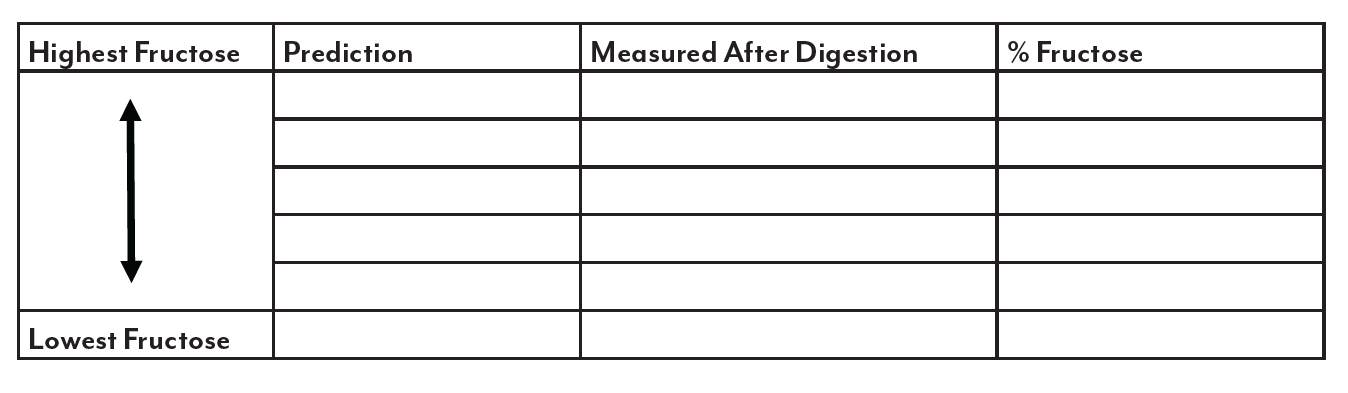
- Predict the order of the sweeteners from lowest glucose to highest glucose. Understanding the base sugars in these sweeteners are primarily glucose and fructose this would be the highest glucose on top and lowest fructose on bottom.
- Have students present their predictions and explain their reasoning.
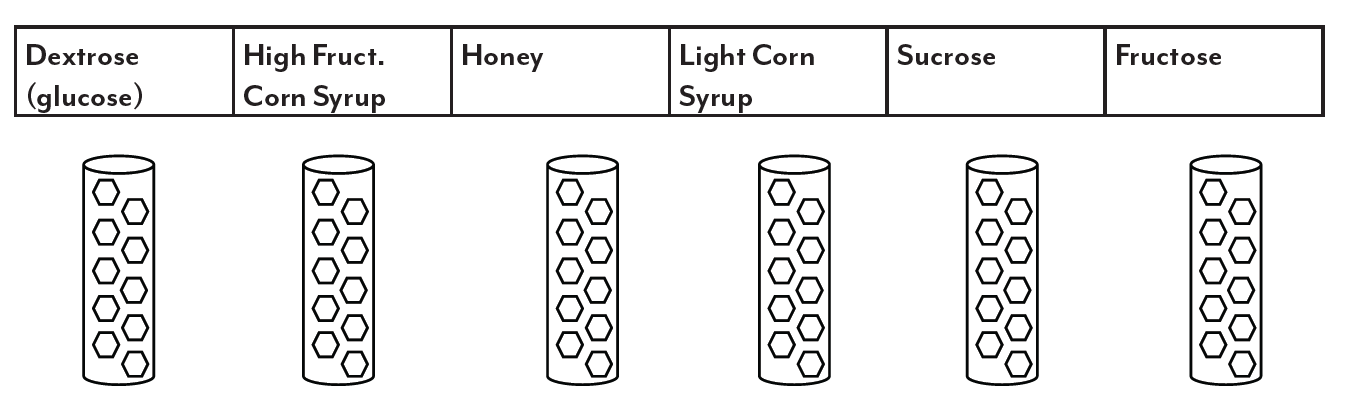
Sweeteners: Dextrose, HFCS, Corn syrup, Honey, Sucrose, Fructose
Honey/Syrup Dehydration (Optional)
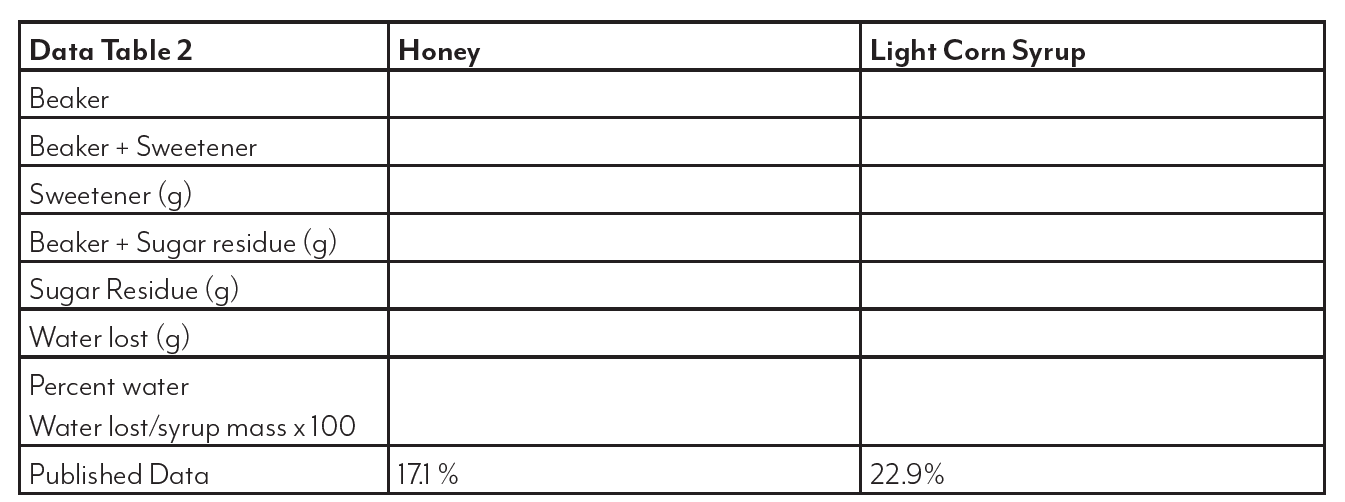
Honey and syrups have a small amount of water in them. Determine the percent water and compare with the published data.
- Using the balance, determine mass of beaker recording to the nearest centigram.
- While on the balance add approximately 20g of the sweetener to the beaker.
- Subtract the mass of the clean beaker to determine the mass of the sweetener to the nearest centigram.
- Place beaker in a drying oven/incubator at 50 °C.
- Let the sample dry for several days.
- When dry remove from heat and allow to cool.
- When sample has cooled determine mass of beaker and sample recording to the nearest centigram.
- Subtract the mass of the clean beaker to determine the mass of the dried solute.
- This mass will be nearly all sugar.
- Determine the percent of water in the sweetener by dividing (the mass lost by heating)/(the mass of the original sample) multiplying by 100.
- Compare the calculated value with the published water composition data.
Comparing sugar composition: Solution preparation
Prepare solutions of equal sugar concentrations of each sweetener for comparison. Each lab group will need a
250 ml beaker, a balance, a type of sweetener, a 100 ml graduated cylinder, and distilled water.
1. Prepare a solution of each sweetener with the same concentration of sugar (carbohydrate).
a. The HFCS soft drink contained 11.00g of carbohydrate in 100 ml
b. If you are using a dry sugar (dextrose, sucrose etc.) add mass exactly 11.00g of sugar in a clean, dry 250 ml
beaker.
c. If using honey (17% water) add 13.25 g of honey into a clean dry beaker. This will contain 11.00g of sugar.
d. Preparing light corn syrup (22.9% water) add 14.26 g of syrup into a clean dry beaker. This will contain
11.00g of sugar and 3.26g of water.
2. Add approximately 75 ml of distilled water to the beaker and stir until dissolved. Solution may be heated
gently on the hotplate to speed this process.
3. When the sample has completely dissolved allow to cool if heat was used.
4. Pour sample into the 100ml graduated cylinder.
5. Fill the graduated cylinder to 100 ml.
6. Pour into beaker and cover sample.
Diluting Samples
Most of these sugar solutions have glucose amounts above the range of the blood glucose meter. A serial
dilution of 1/10 and 1/100 concentrations will be prepared to produce solutions in the range of the meters.
Day 1
1. Label two 250 ml beakers with sweetener and 1/10 and 1/100 respectively.
2. Using a pipette add exactly 10 ml of the prepared sweetener solution to a 100 ml graduated cylinder.
3. Add distilled water to fill the cylinder to exactly 100 ml.
4. Pour this solution into a beaker labeled 1/10 and stir well.
5. Rinse graduated cylinder well.
6. Using a pipette add exactly 10 ml of the 1/10 sweetener solution prepared in steps 2-4 into the 100 ml
graduated cylinder.
7. Add distilled water to fill the cylinder to exactly 100 ml.
8. Pour this into the 1/100 dilution beaker.
9. Repeat steps 5-8 to produce a second 100 ml of 1/100 dilution if samples for more than 5 groups will be
needed.
10. Label two 50 ml centrifuge tubes with each type of sweetener and 1/100 no enzymes and 1/100 enzymes.
11. Split the 100 ml sample evenly between the two centrifuge tubes.
12. Replace the cap on the tube labeled no enzymes.
13. To the sample labeled enzymes add 2ml of invertase and 2 ml of glucoamylase.
14. Replace cap and invert gently to mix enzymes thoroughly.
15. Store tubes at room temperature overnight to allow hydrolysis to occur.
Day 2
1. Using a 10 ml pipette, add 10 ml of the 1/100 solution to each of the centrifuge tubes.
2. Rotate to different stations and collect 2 samples of 1/100 solution of each type of sweetener.
Testing free glucose:
The amount of free glucose can be measured in each of the sweeteners. This will only detect glucose monomers
and will not detect glucose present in disaccharide forms.
1. Insert a glucose test strip into the meter.
2. Remove the cap from the “No Enzyme” centrifuge tube.
3. Gently tip the tube and touch the test strip to the solution.
4. The meter will read the glucose concentration in μg/dL.
5. Repeat for all sweetener solutions.
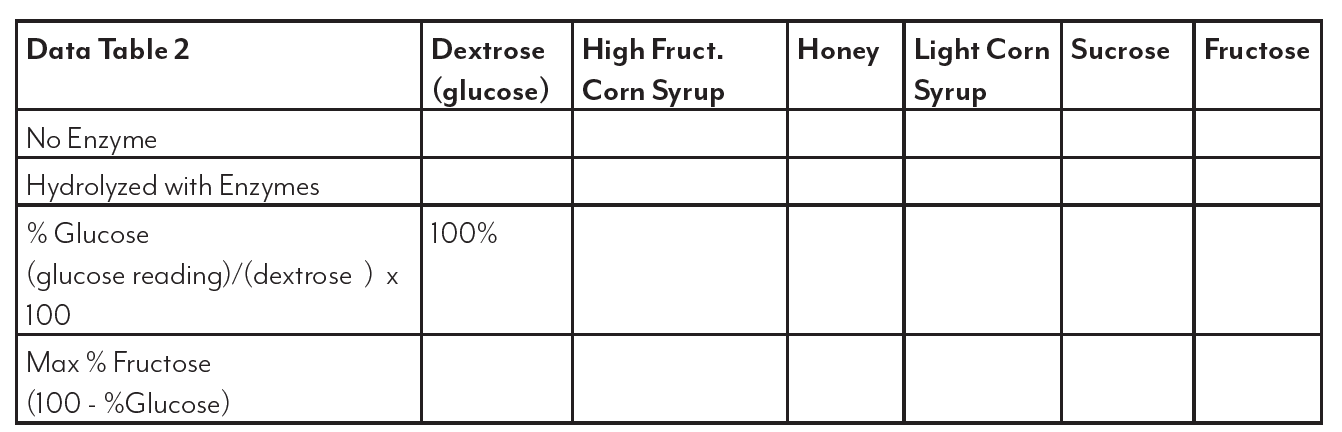
6. Record these values in data table 2.
7. If the reading is (Lo) or low, record as Lo which means less than 20μg/dL.
The amount of glucose will now be measured in each of the hydrolyzed sweeteners. These readings may be
significantly higher if the sweetener contained disaccharides maltose and sucrose that were broken releasing
glucose molecules.
8. Repeat steps 2 through 6 for each of the enzyme hydrolyzed solutions.
9. Calculate and record the percent glucose of the highest reading by dividing it by the reading for the dextrose
in data table 2.
10. Calculate the maximum fructose percentage by subtracting the glucose percentage from 100.
Procedure for Lab
Procedure for checking the accuracy of sugar content on a soft drink label (Optional)
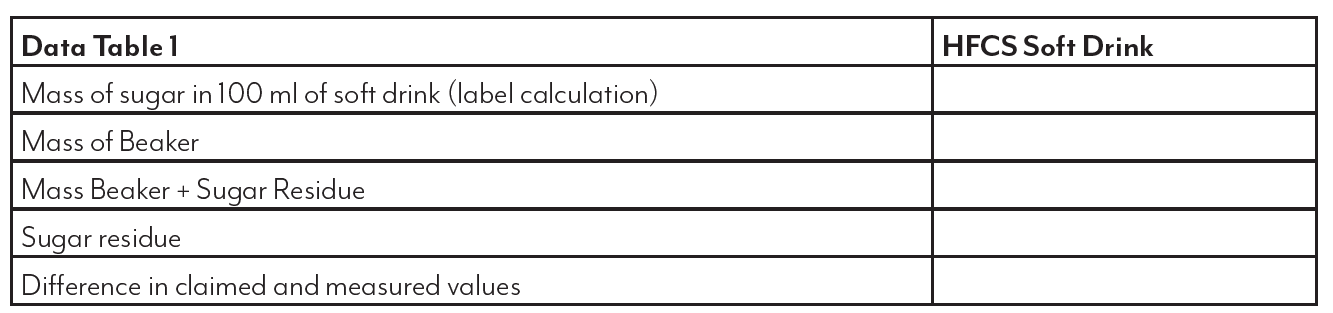
Several of the sweeteners being tested contain water. High fructose corn syrup is difficult to purchase in pure form so we will use a soft drink for testing. The concentration, amount of sugar in 100 ml of the soft drinks will be measured by dehydrating the soft drink.
Materials
- 100 ml Graduated cylinder
- Balance
- 250 ml Beakers
- Hot plate or drying oven
- Soft drink containing HFCS
Soft Drink Hydration
- Find and record the amount of carbohydrates in one serving on the label.
- Record the volume of a serving as marked on the label in ml.
- Divide the mass of carbohydrate by serving volume and multiply by 100 ml. Record this as the predicted amount of sugar in 100 ml.
- Pour approximately 150 ml of the soft drink into a beaker.
- Pour the sample from one beaker to another and back again several times to reduce carbonation.
- Rinse and dry the empty beaker.
- Using a balance, determine mass of the beaker, recording to the nearest centigram.
- Using a 100 ml graduated cylinder measure exactly 100 ml of soft drink.
- Pour this sample into the clean beaker.
- Place beaker on a hotplate on low heat.
- Let the sample dry.
- When dry remove from heat and allow to cool.
- When sample has cooled determine mass of beaker and sample recording to the nearest centigram.
- Subtract the mass of the clean beaker to determine the mass of the sugar that was dissolved in the soft drink.
- This mass will be nearly all sugar.
- Compare this mass with the label mass.
Honey/Syrup Dehydration (Optional)
Honey and syrups have a small amount of water in them. Determine the percent water and compare with the published data.
- Using the balance, determine mass of beaker recording to the nearest centigram.
- While on the balance add approximately 20g of the sweetener to the beaker.
- Subtract the mass of the clean beaker to determine the mass of the sweetener to the nearest centigram.
- Place beaker in a drying oven/incubator at 50 °C.
- Let the sample dry for several days.
- When dry remove from heat and allow to cool.
- When sample has cooled determine mass of beaker and sample recording to the nearest centigram.
- Subtract the mass of the clean beaker to determine the mass of the dried solute.
- This mass will be nearly all sugar.
- Determine the percent of water in the sweetener by dividing (the mass lost by heating)/(the mass of the original sample) multiplying by 100.
- Compare the calculated value with the published water composition data.
Reflection and Conclusion
After calculating fructose levels have students fill out table 1, placing sweeteners in order of most fructose to least
fructose including percent calculated.
To visualize the relative amounts of glucose and fructose in each sweetener, round the percentage of glucose to
the nearest ten and divide by ten. Color that many hexagons green in the vial. Perform the same calculations for
the fructose percentage and color those hexagons red.
About Kansas Corn STEM
Investing in Kansas teachers and students is a priority for the Kansas Corn Commission. We are committed to providing materials and training to support STEM education while fostering an understanding of how corn farming and agriculture fit into our daily lives. Professional development workshops are offered to teachers seeking to expand their knowledge and inquiry-based teaching skills. Workshop participants receive free lab supplies needed for the lessons.
Workshop InfoThis lesson is the work product of the Kansas Corn Commission. Our lessons are written in collaboration with Kansas teachers for use in the classroom. Teachers may copy and share this curriculum. Use of this product for commercial or promotional use is prohibited without express permission of Kansas Corn.
Newsletter Sign Up
Each quarter we release a newsletter written by teachers for teachers. This is an easy way to keep up with what is happening at Kansas Corn STEM.
Subscribe Today!